| Bus/Ind | Eng/Sci | Onsites | Public | Virtual | Manuals | Rewards | Contact |
Home > Excel Classes > Excel Dashboards Bus/Ind
| Bus/Ind | Eng/Sci | Onsites | Public | Virtual | Manuals | Rewards | Contact |
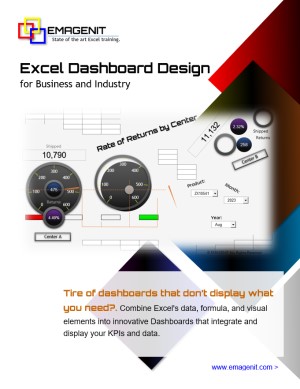
Learn the secrets to designing adaptive dashboards in Microsoft Excel that shape, integrate, and calculate your data the way you need and display your key KPIs.
Next Class: Check Dates
View and Download Brochure
Day-1
Day-2
Day-3
|
|
|
|
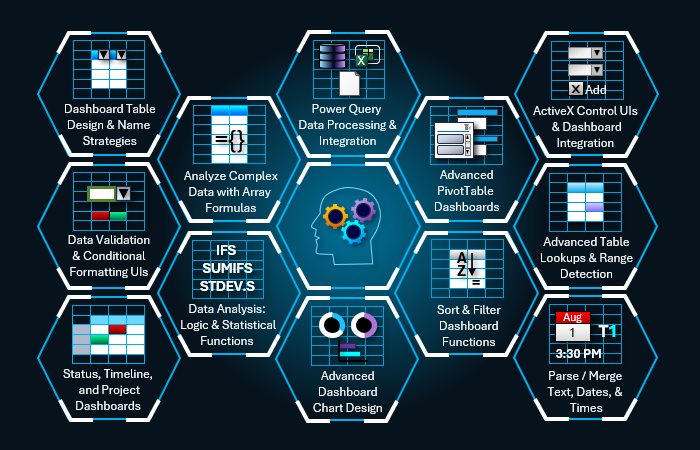
Learn to use formulas, Conditional Formatting, filter functions, and spill over arrays to create adaptive data displays that auto format.
Learn to perform complex table lookups, find and fill tables using logic, calculate dates, and analyze statistics.
Learn to create project timelines and use logic functions, concatenation, and text functions to sum and analyze dashboard data.
Learn to create user interfaces from ActiveX, Data Validation, Charts, and shapes that control your dashboard displays and formulas.
Learn to use Pivot Tables, Pivot Charts, and slicers to be rapidly group, sum, and count data in your dashboards.
Learn to create maps and use Power Query to link, clean, merge, and shape text, workbook, and database data.
Learn about the different dashboard types (scorecard, tactical...) and how to create their KPIs using Excel functions and formulas.
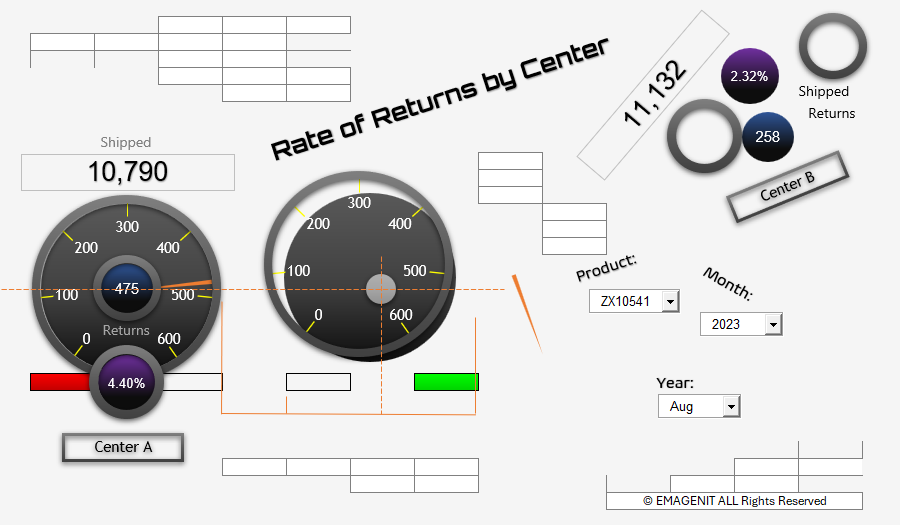
Learn to create various chart gauges by combining doughnut, pie, bar... charts with shapes and Conditional Formatting.
Learn to build dynamic dashboard displays from ranges, shapes, and names that toggle pictures and fill table data in shapes.
Learn to toggle between tables in formulas; process complex datasets with array formulas; and design status and calendar displays.
 |
 |
 |
 |
 |
 |
 |
 |
 |
 |

Live Virtual We can train you live, hands-on virtually over the web. |

Live In-Person We can train you in person, hands-on at a public class. |
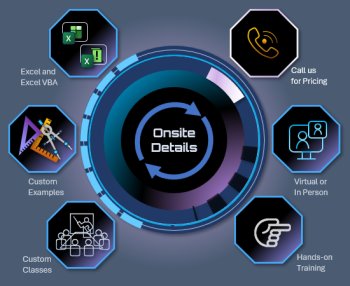
Business Onsite We can train your business live in-person or virtually anywhere. |
Self-Study Manual Buy the self-study manual now, apply the price to a class later. |
Virtual Schedule
| Dates | Price | Time | Details | Time Zone | Purchase |
|---|---|---|---|---|---|
| 05/26/26 - 05/28/26 | $849.00 | 9:00 - 5:00 CT | Virtual Details > | Central Time |
Add to Cart
|
| 05/26/26 - 05/28/26 | $949.00 | 9:00 - 5:00 CT | Public Details > | Nashville, TN |
Add to Cart
|
Phone Number: 1.629.325.9937
Business Hours: Mon-Fri 8:00 AM - 7:00 PM CT
You can email us at info@emagenit.com >
Excel Training Services
Excel Classes - Business and Industry
Beginning Excel for Business and Industry
Intermediate Excel for Business and Industry
Advanced Excel for Business and Industry
Excel Dashboards for Business and Industry
Beginning Excel VBA for Business and Industry
Excel Classes - Engineers / Scientists
Microsoft Excel Essentials for Engineers and Scientists
Excel Data Analysis for Engineers and Scientists
Excel VBA Fundamentals for Engineers and Scientists
Excel VBA Data Analysis for Engineers and Scientists
Microsoft Excel Manuals
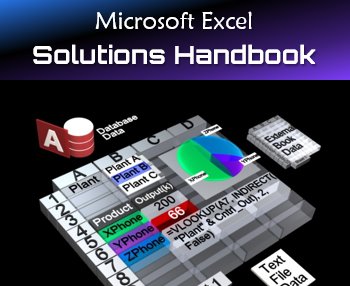
Microsoft Excel Solutions Handbook
Creating Advanced Excel VBA Apps
Microsoft Excel All-in-One Manual
Excel VBA Design for Engineers and Scientists
Advanced Excel VBA Design for Engineers and Scientists
EMAGENIT Company Information
US Military
Copyright © 2026. EMAGENIT All Rights Reserved
