| Schedule | Classes | Onsites | Manuals | Customers | Contact | About |
This page reviews how Excel VBA can be used to quickly develop various tools including data, modeling, analysis, and dashboard tools.

Additional Tutorial Topics:
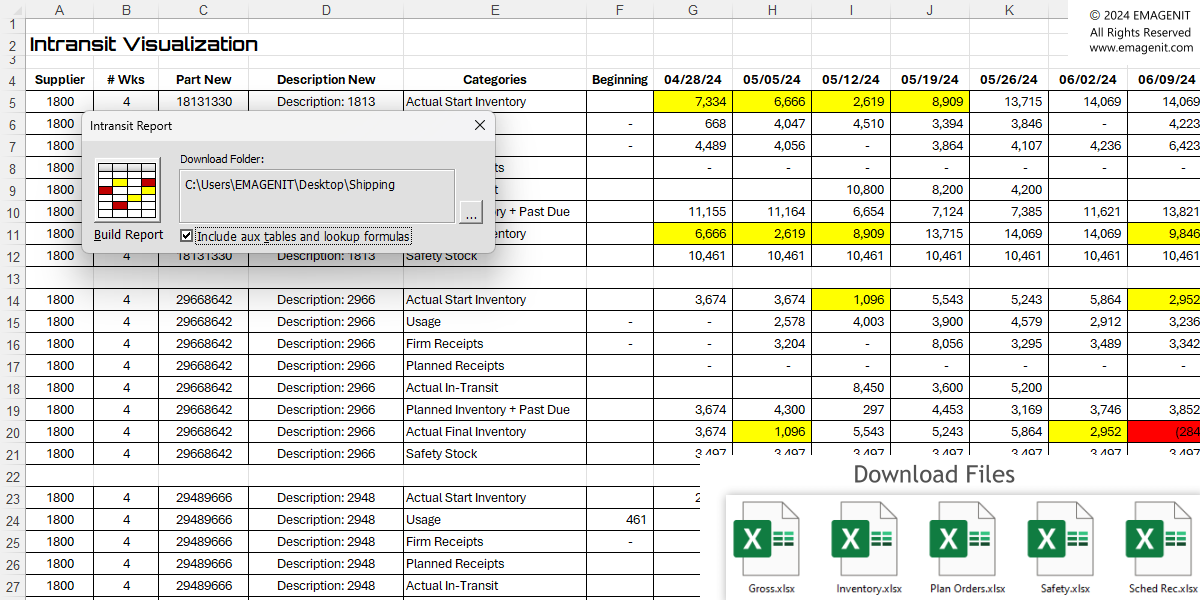
Visual Basic for Applications (VBA) can be used in conjunction with Microsoft Excel to construct automated tools. Using VBA with Excel, powerful data analysis tools can be quickly developed with minimal cost. Excel VBA can be used for important data tasks like:

Scroll < > picture if hidden.
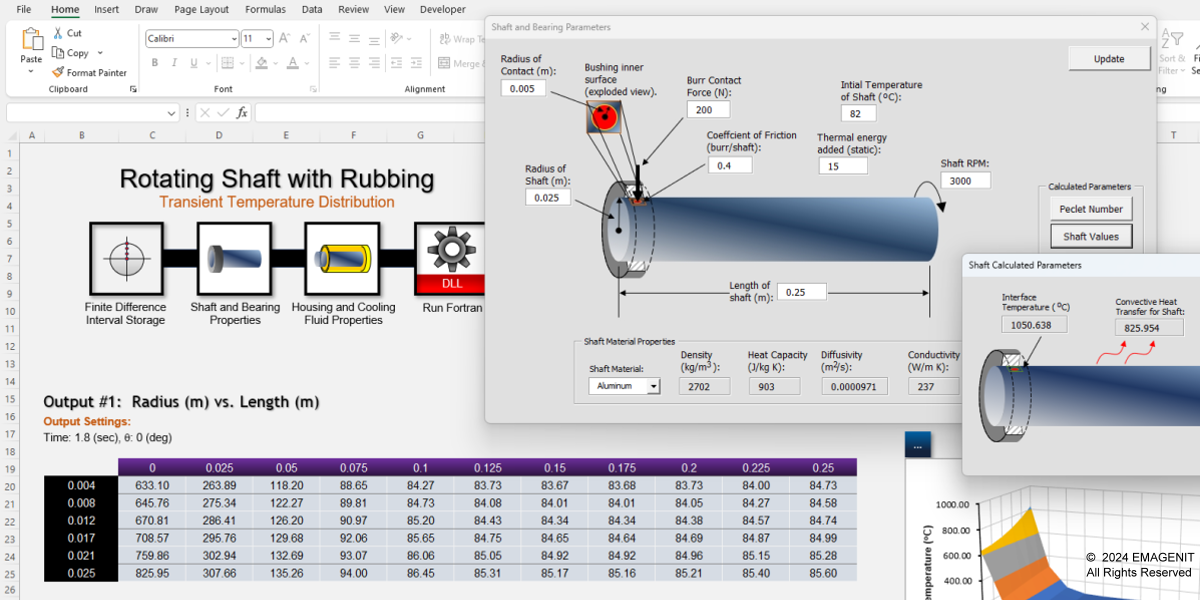
Excel and VBA can be quickly combined to create powerful modeling and analysis tools for business, engineering, and science. The worksheet / Excel VBA combination provides the ability to quickly layout models and problems, organize their calculations, and graphically display their results. Powerful user interfaces can also be developed to control complex models.
Excel VBA can also be used to create and manage worksheet formulas allowing legacy formula based models or problems to be rapidly altered and made adaptive to users needs.
VBA also provides the capability to perform advanced calculations and run numerical analysis methods. Custom worksheet functions (UDFs) can also be created to replace cumbersome worksheet calculations and custom UDF libraries can be deployed to rapidly build models or to analyze problems.
Excel VBA can also be used to run legacy code written in another language like VB.Net, C..., Fortran tapping into its speed and "off the shelf" the functionality (why recreate it and verify it?)

Scroll < > picture if hidden.
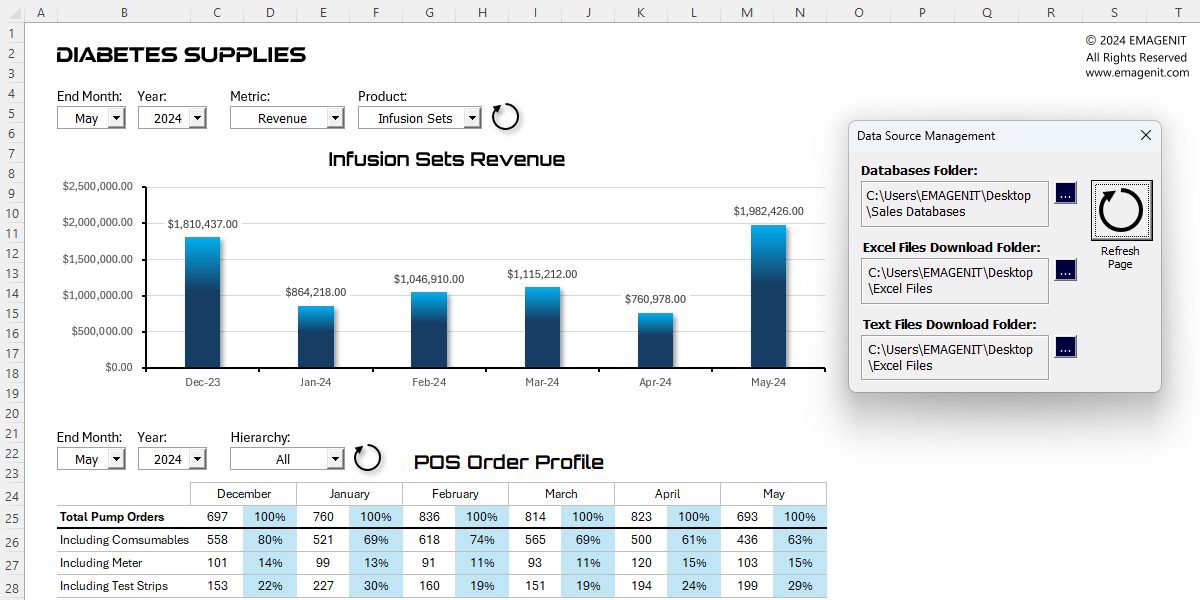
Excel and VBA can be used to quickly create a variety of dashboards and visual data displays for business, engineering, and science. Using the worksheet / Excel VBA combination provides the ability to quickly layout dashboard using charts, diagrams, pictures, cells, and ActiveX controls. Excel VBA can be used for important dashboard tasks like:

Scroll < > picture if hidden.
Excel Training Services
Excel Classes - Business and Industry
- Beginning Excel for Business and Industry
- Intermediate Excel for Business and Industry
- Advanced Excel for Business and Industry
- Excel Dashboards for Business and Industry
- Beginning Excel VBA for Business and Industry
Excel Classes - Engineers / Scientists
- Microsoft Excel for Engineers for Scientists
- Excel Data Analysis for Engineers and Scientists
- Excel VBA for Engineers and Scientists
- Excel VBA Data Analysis for Engineers and Scientists
Microsoft Excel Manuals
- Microsoft Excel Solutions Handbook
- Creating Advanced Excel VBA Apps
- Excel VBA Handbook for Engineers and Scientists
- Excel VBA App Design for Engineers and Scientists
EMAGENIT Company Information
US Military
Copyright © 2025
EMAGENIT All Rights Reserved