| Bus/Ind | Eng/Sci | Onsites | Public | Virtual | Manuals | Rewards | Contact |
Home > Excel Engineering and Science Classes
| Bus/Ind | Eng/Sci | Onsites | Public | Virtual | Manuals | Rewards | Contact |
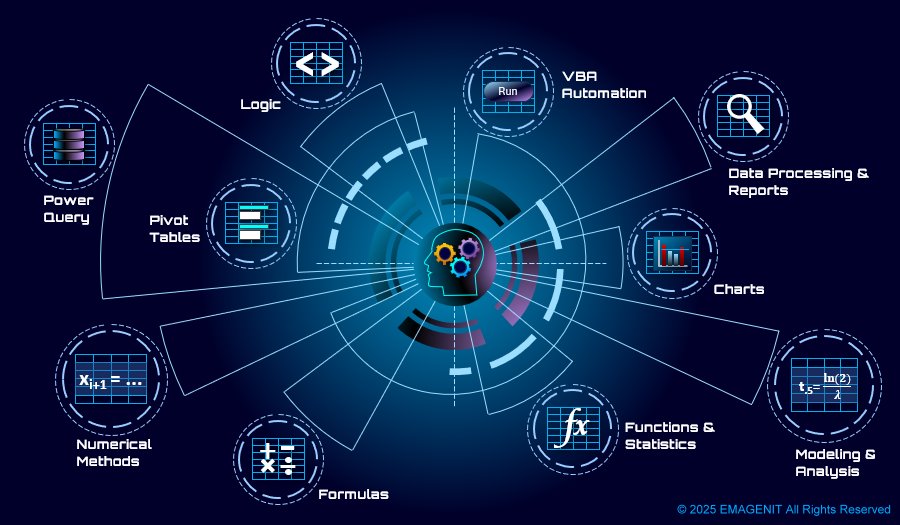
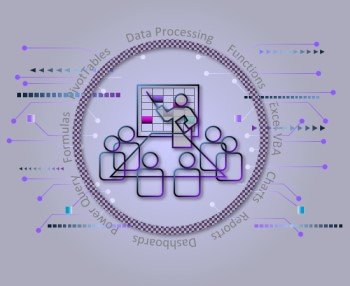
Our Excel classes for engineers and scientists show you how to calculate those tough problems, analyze that data, or construct those automated technical tools. They'll show you hands-on how to create everything from formulas and logic to charts and dashboards to advanced Excel VBA apps.
Public, Virtual, Onsite, Self-Study
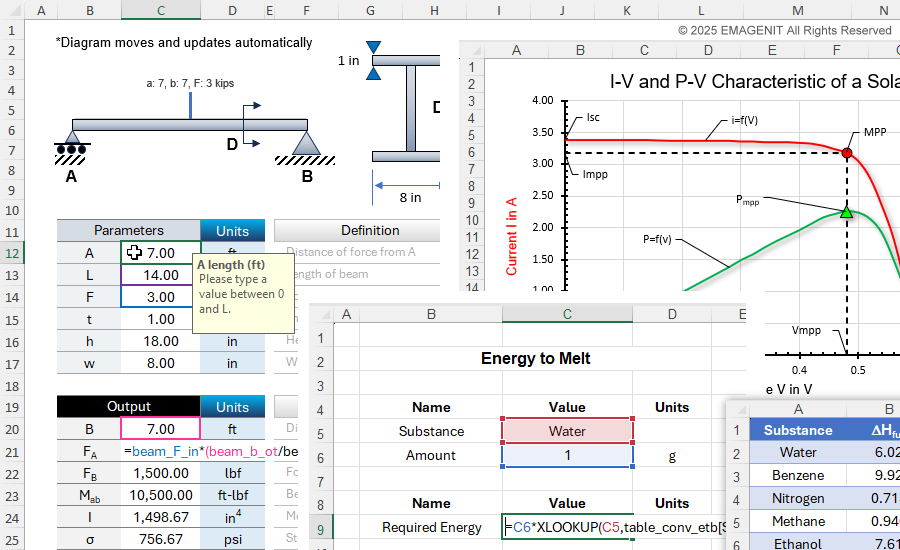
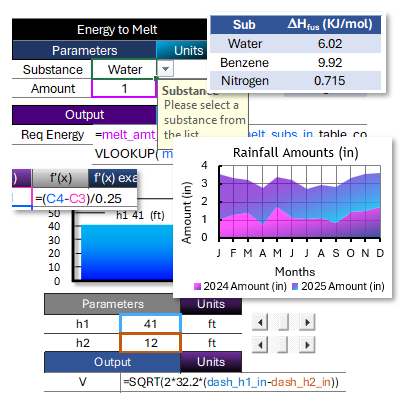
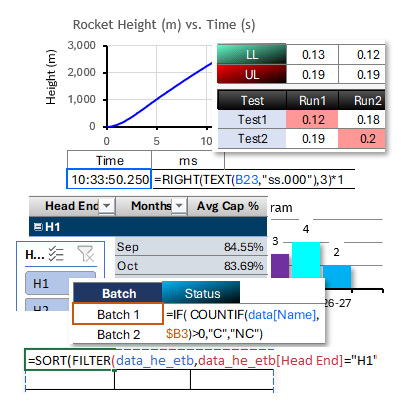
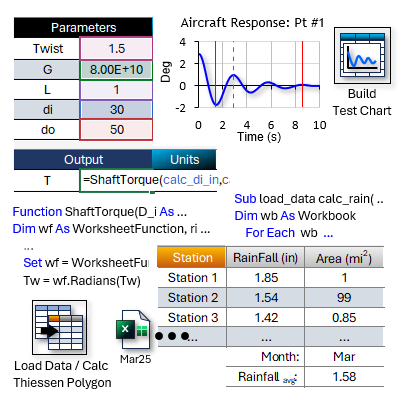
About the picture: In the Excel picture, parameters and formulas are used to calculate various I-beam outputs. Cell names, Data Validation, charts, and shapes are used to create the dynamic interface. Also pictured is a solar cell chart that displays current and power along with various critical points. The picture also shows XLOOKUP functions and Excel tables being used to calculate the energy to melt a substance.
Microsoft Excel
Essentials
|
Excel Data Analysis
|
||
|
|

Live Virtual We can train you live, hands-on virtually over the web. |
Live In-Person We can train you in person, hands-on at a public class. |
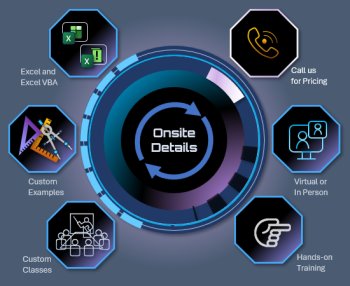
Business Onsite We can train your business live in-person or virtually anywhere. |
Self-Study Manual Buy a self-study manual, apply the price later to a class >. |
Excel VBA
Fundamentals
|
Excel VBA Data Analysis
|
Advanced Excel VBA
|
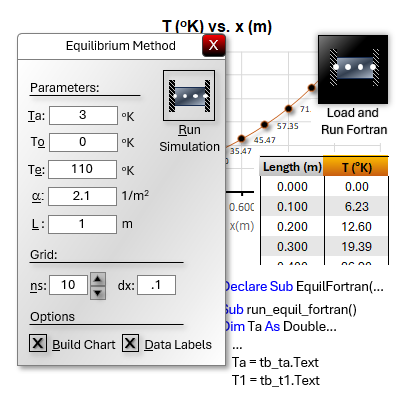
Creating Advanced Tools with Fortran and Excel VBA3-days. Learn to combine the speed of Fortran with the GUI, charting, modeling, and data processing capabilities of Excel VBA to create lightning-fast tools. |
|||
|
|
|
|
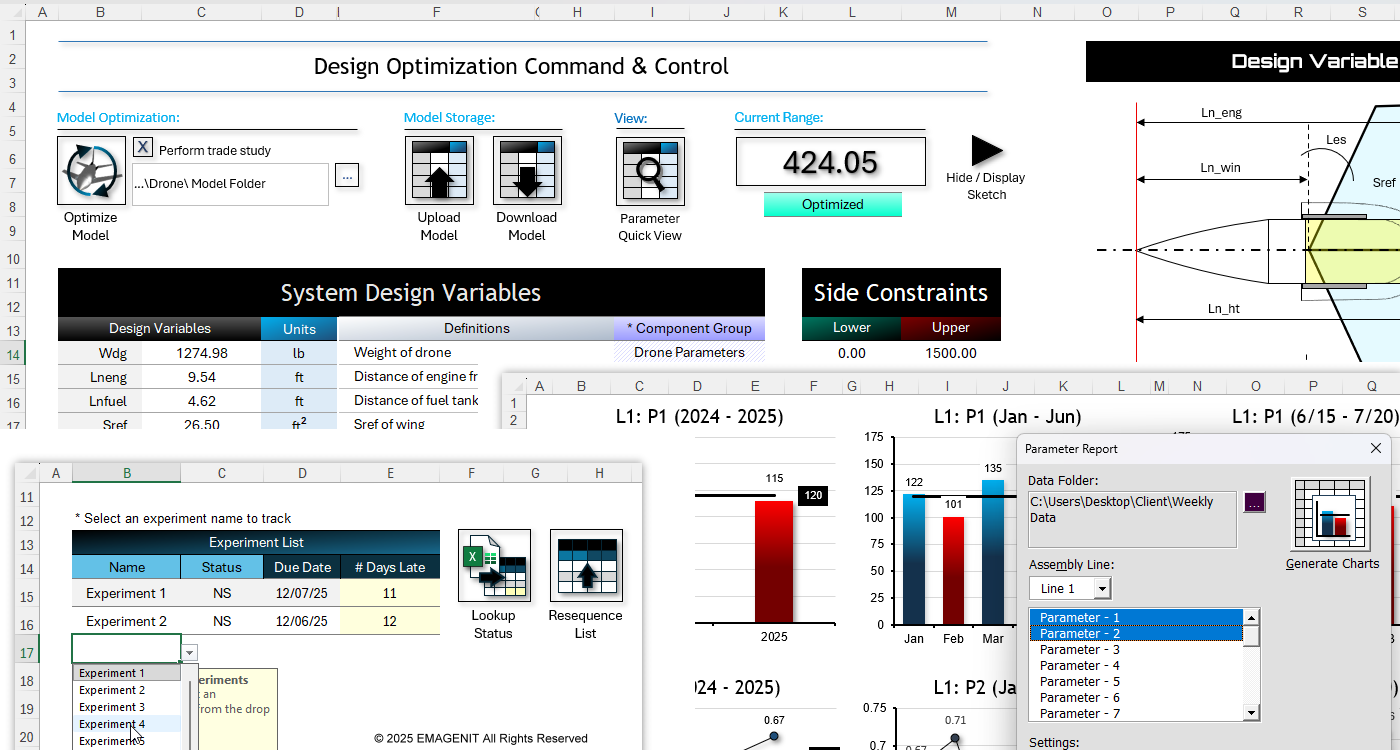
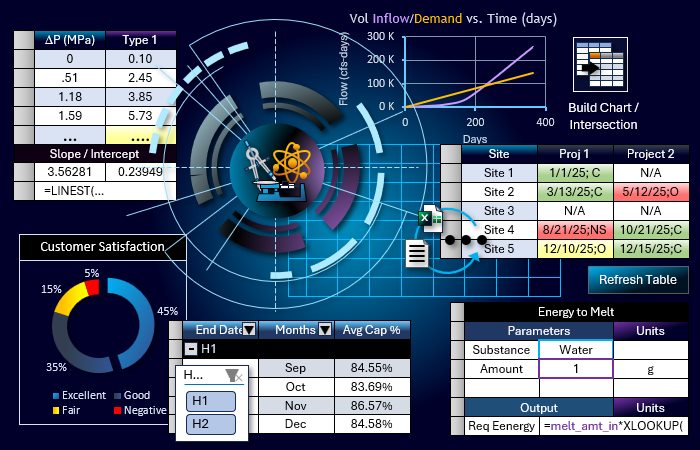
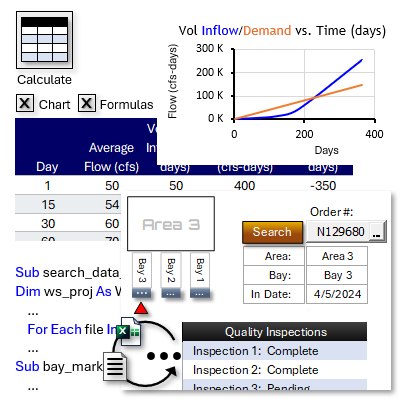
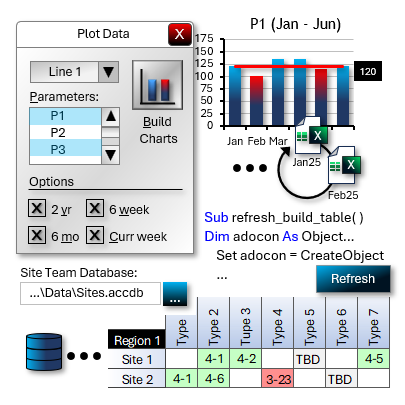
About the picture: In the Excel picture, 5 workbooks are linked and used to create a drone model, Excel VBA manages it, and Solver optimizes. VBA UDFs and Fortran do the calculations. Also pictured is a simple VBA program that tracks selected experiments from two files and displays their status, due date, and the # of days past due. Also pictured is a VBA charting add-in that scans hundreds of download workbooks, creates a report workbook, charts selected parameters, and emails the report. The take away from this example is complex processes, models, and displays can be rapidly developed in Excel VBA at low cost and time.
Excel Training Services
Excel Classes - Business and Industry
Beginning Excel for Business and Industry
Intermediate Excel for Business and Industry
Advanced Excel for Business and Industry
Excel Dashboards for Business and Industry
Beginning Excel VBA for Business and Industry
Excel Classes - Engineers / Scientists
Microsoft Excel Essentials for Engineers and Scientists
Excel Data Analysis for Engineers and Scientists
Excel VBA Fundamentals for Engineers and Scientists
Excel VBA Data Analysis for Engineers and Scientists
Microsoft Excel Manuals
Microsoft Excel Solutions Handbook
Creating Advanced Excel VBA Apps
Microsoft Excel All-in-One Manual
Excel VBA Design for Engineers and Scientists
Advanced Excel VBA Design for Engineers and Scientists
EMAGENIT Company Information
US Military
Copyright © 2026. EMAGENIT All Rights Reserved
