| Bus/Ind | Eng/Sci | Onsites | Public | Virtual | Manuals | Rewards | Contact |
Home > Excel Business and Industry Classes
| Bus/Ind | Eng/Sci | Onsites | Public | Virtual | Manuals | Rewards | Contact |
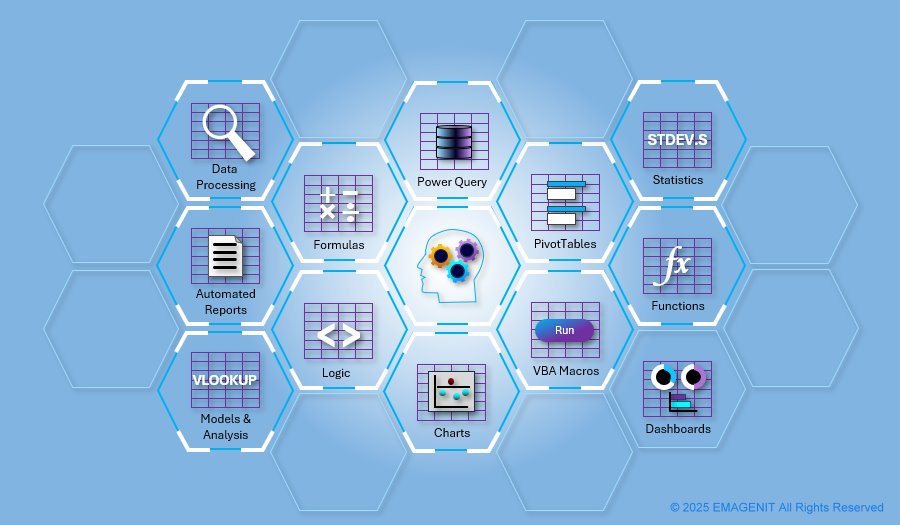
Our customer focused Excel classes demonstrate Excel's unique problem solving and tool construction capabilities for business and industry. They show you hands-on how to create everything from tables and formulas to advanced Excel VBA apps.
Public, Virtual, Onsite, Self-Study
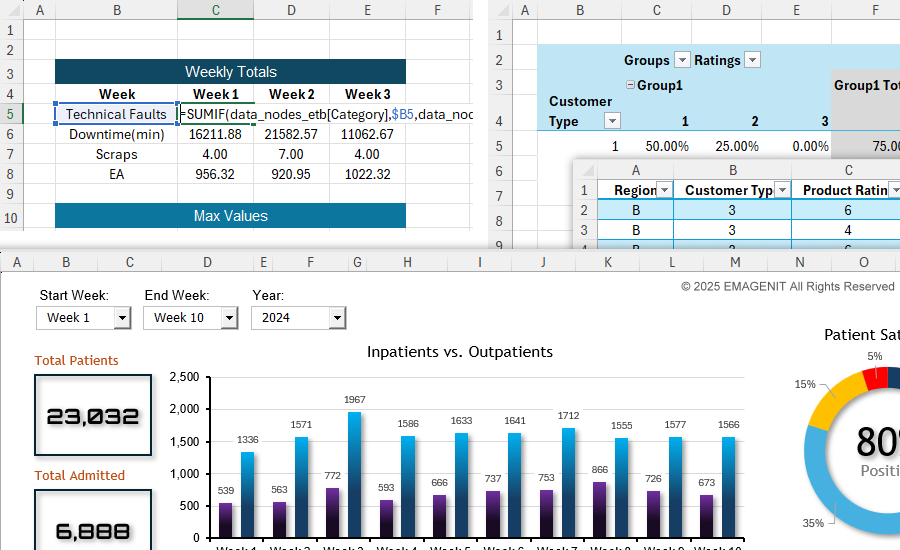
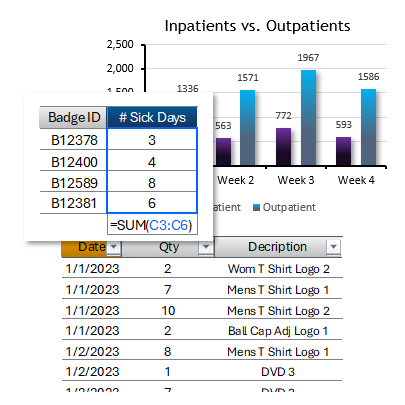
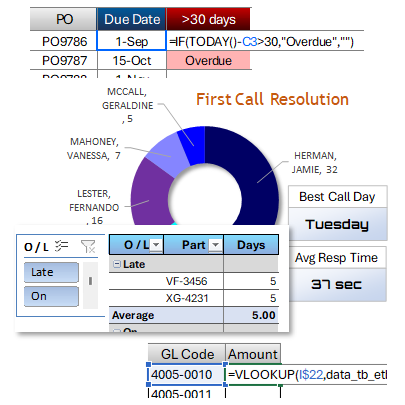
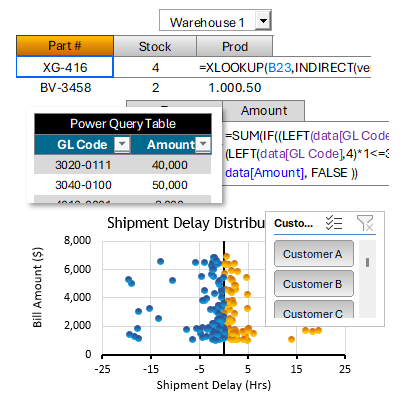
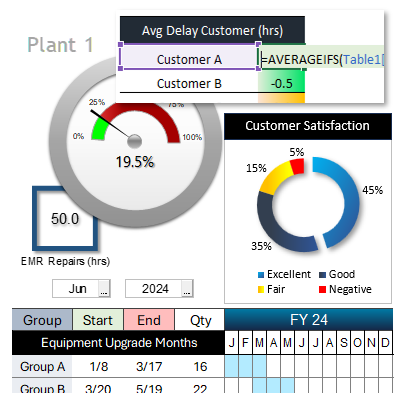
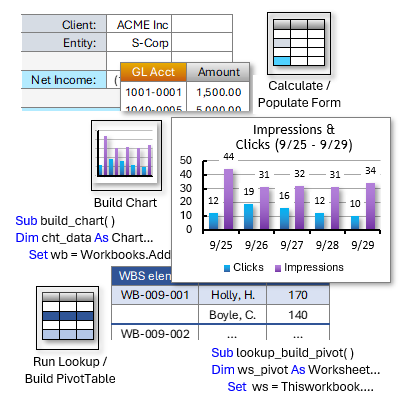
About the picture: In the Excel picture, a SUMIF function is being used to tally various production KPIs from an Excel table. Also pictured is a PivotTable that groups and calculates the % types from a satisfaction survey report. The graphic also shows a dashboard that uses ActiveX, Charts, and shapes to display hospital metrics.
Beginning Excel
|
Intermediate Excel
|
Advanced Excel
|
Excel Dashboard Design
|
|||
|
|
|
|

Live Virtual We can train you live, hands-on virtually over the web. |

Live In-Person We can train you in person, hands-on at a public class. |
Business Onsite We can train your business live in-person or virtually anywhere. |

Self-Study Manual Buy a self-study manual, apply the price later to a class. |
Beginning Excel VBA
|
Excel VBA Data Processing
|
Advanced Excel VBA
|
||
|
|
|
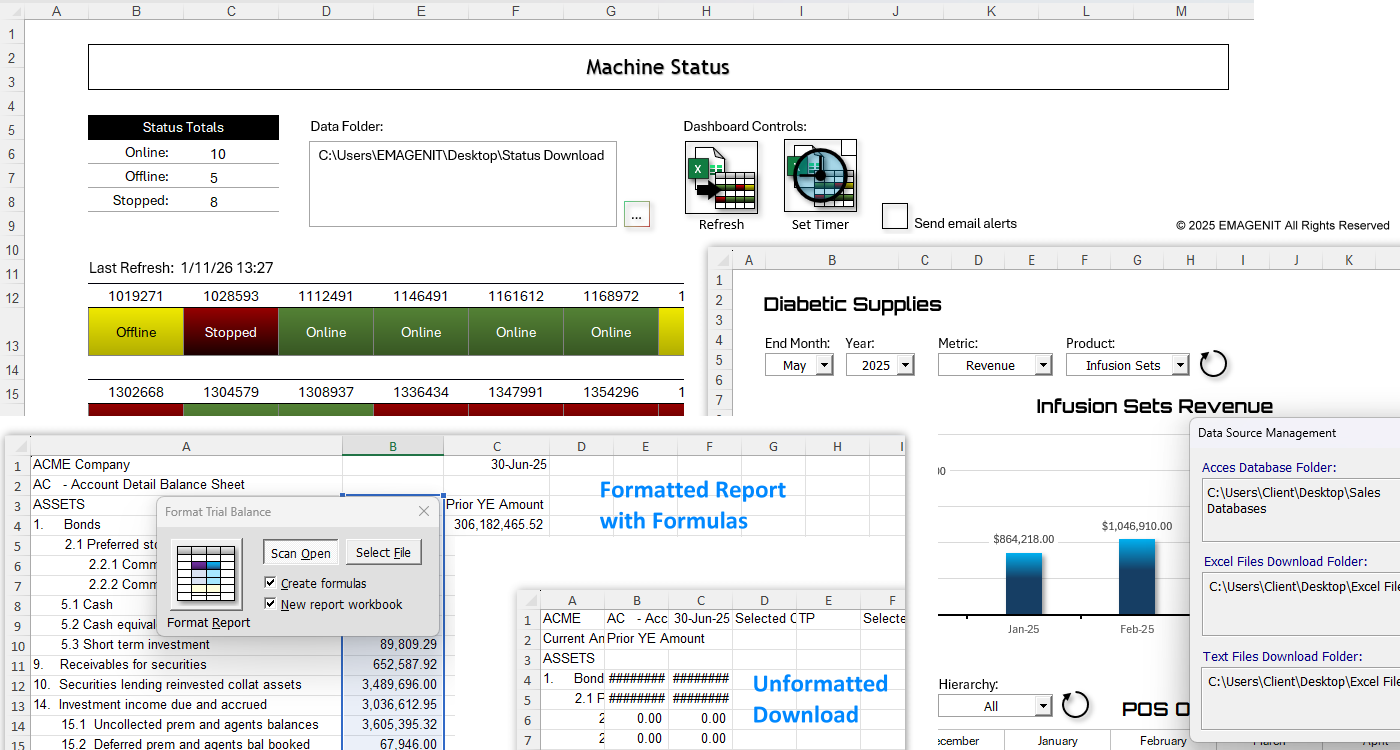
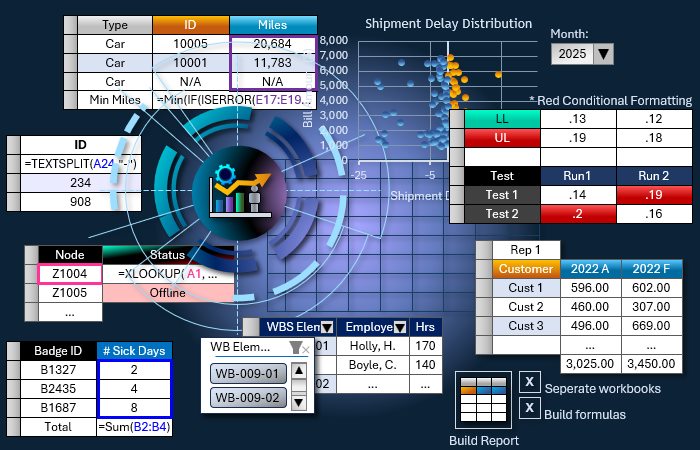
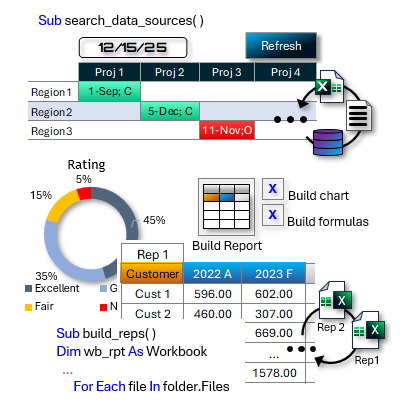
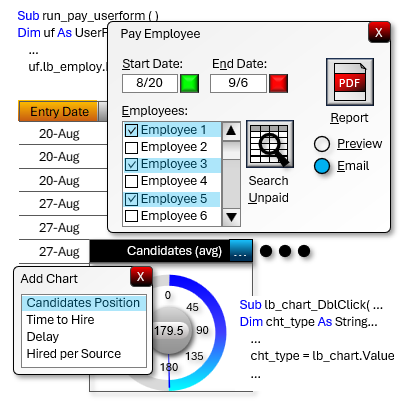
About the picture: In the Excel picture, a worksheet based status report tool uses VBA to read factory text file downloads at specific times, redraw its interface, and email status reports. Also pictured is a VBA formatting add-in that scans for a download workbook, transfers its data to a new workbook, reformats the data, deletes unwanted columns/rows, and inserts formulas. The graphic also shows a VBA based revenue dashboard that integrates multiple Access databases, text file downloads, and storage workbooks then displays their data. The take away from these examples, use what you have and let Excel VBA integrate, format, and process the data.
Excel Training Services
Excel Classes - Business and Industry
Beginning Excel for Business and Industry
Intermediate Excel for Business and Industry
Advanced Excel for Business and Industry
Excel Dashboards for Business and Industry
Beginning Excel VBA for Business and Industry
Excel Classes - Engineers / Scientists
Microsoft Excel Essentials for Engineers and Scientists
Excel Data Analysis for Engineers and Scientists
Excel VBA Fundamentals for Engineers and Scientists
Excel VBA Data Analysis for Engineers and Scientists
Microsoft Excel Manuals
Microsoft Excel Solutions Handbook
Creating Advanced Excel VBA Apps
Microsoft Excel All-in-One Manual
Excel VBA Design for Engineers and Scientists
Advanced Excel VBA Design for Engineers and Scientists
EMAGENIT Company Information
US Military
Copyright © 2026. EMAGENIT All Rights Reserved
