| Signup | Classes | Onsites | Manuals | Software | Contact | About |
Home > Excel Classes > VBA Editor and Project
This page reviews the VBA Editor, its windows, VBA project elements, and the VBA debugger.
Want to learn more? Excel VBA classes for business & industry > and engineering & science >.
Additional Tutorial Topics:
When observing VBA code in the Editor, you will see the code is organized in what are called projects. A VBA project in Excel is defined as a collection of VBA modules, userforms, references, and various other programming elements like ActiveX controls. There is only one VBA project per workbook file. If you have 2 workbooks open, you will see 2 projects Editor.
VBA projects are automatically created when your create a workbook file. You can only have 1 project per workbook; they are part of the workbook file.
To save your VBA project and its code, you save the workbook file that contains them as an Excel Macro Enabled Workbook (.xlsm). Whenever you edit your project code or make changes to the project, save the workbook file. To open a VBA project and run its code, open the workbook that contains it.
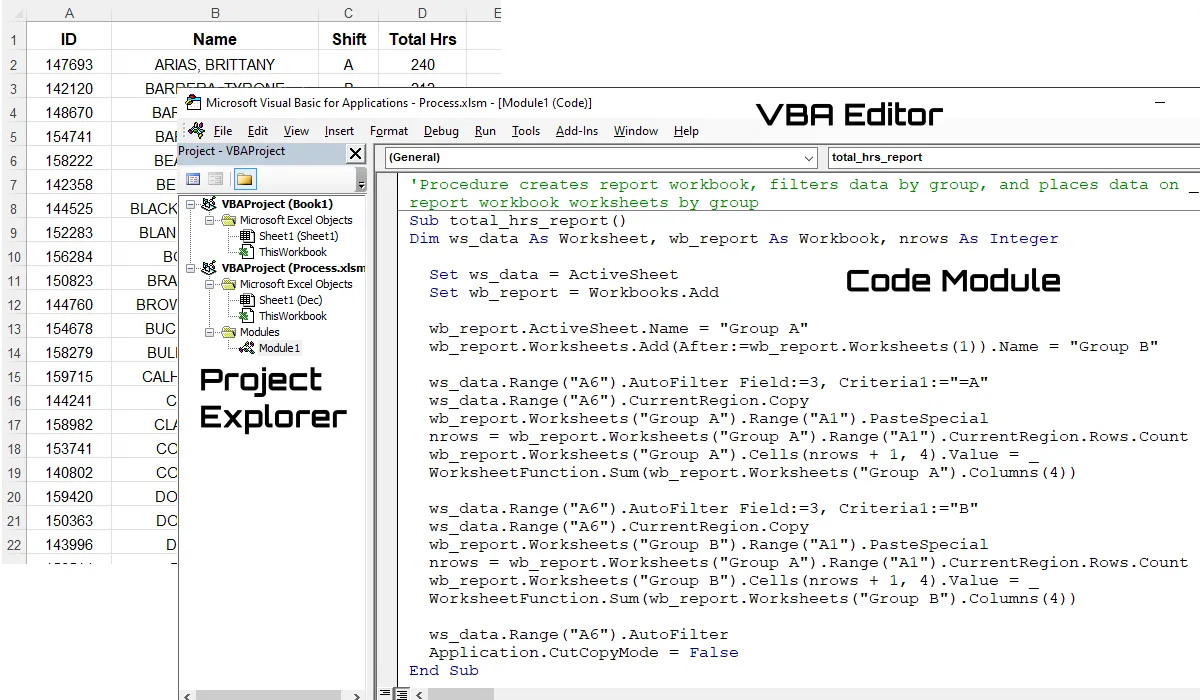
The VBA project for your workbook is viewed and edited in a separate window from Excel commonly referred to as the VBA Editor or Visual Basic Editor. Your projects are organized in the Project Explorer window in the Editor. Look inside the ( )'s in the Explorer window to determine what workbook file a project belongs to.
You can open and close the Editor at will without losing changes to your VBA code, just make sure to save the workbook file containing the project before closing it.
Scroll < > picture if hidden.
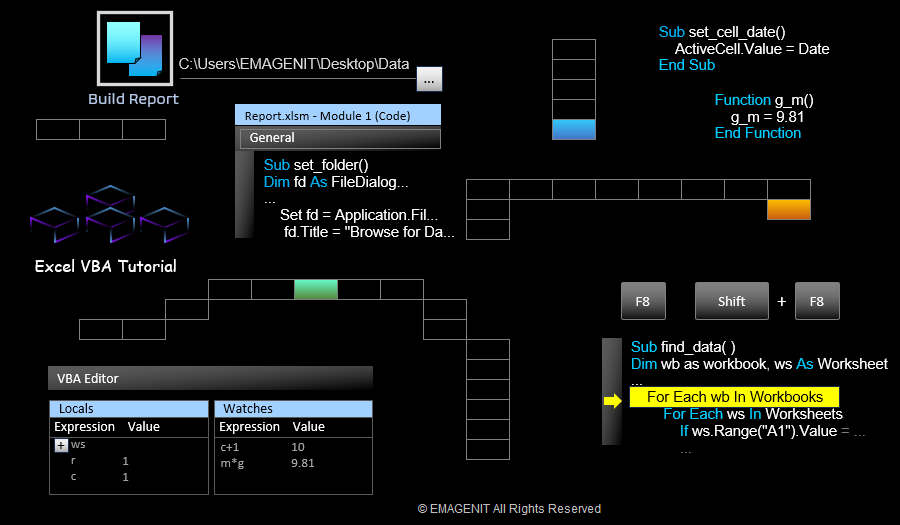
The VBA Editor is where you view, type, edit, debug, and test run your VBA code >. You activate the VBA Editor in Excel by pressing the Alt + F11 keys on your keyboard. You can toggle back and forth between the Excel and Editor windows using those keys or the Windows taskbar buttons for Excel.
The Editor is comprised of the following main windows:
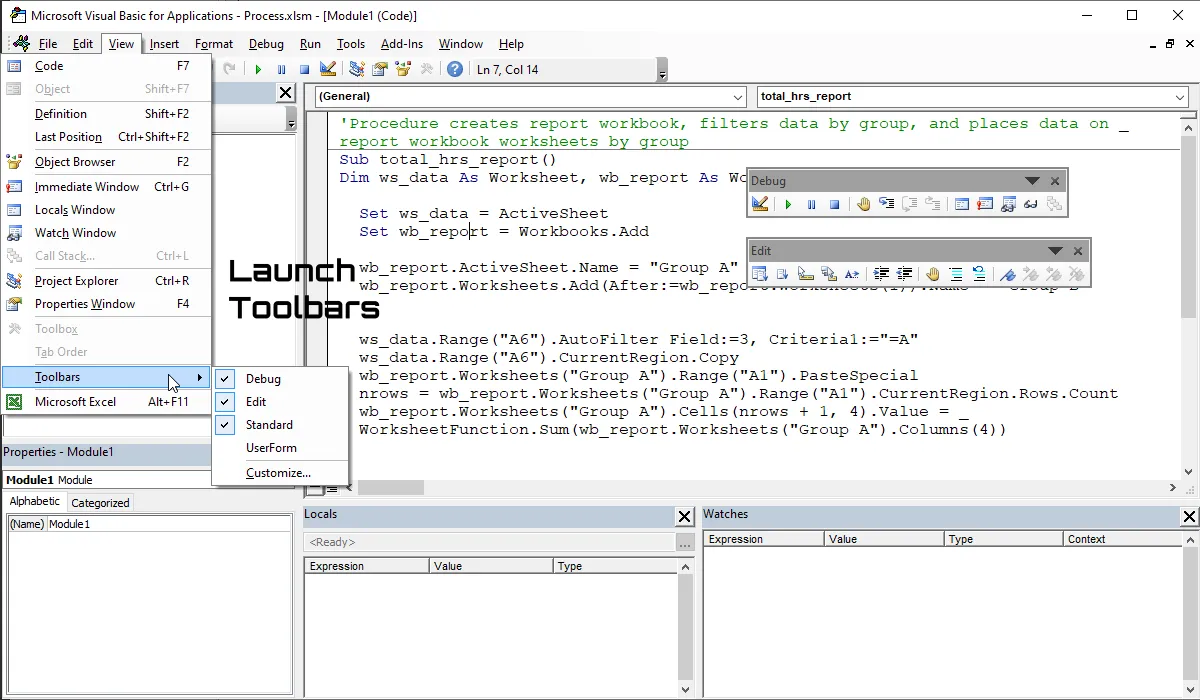
To open these Editor windows, proceed to the View menu in the Editor menu bar and select one. You will also find the shortcut keys for them in this menu. Always leave the Project Explorer and Properties windows open while using the Editor.
VBA code is typed in what are called modules which you can learn about here >. You can also use the Editor to build userforms which are basically floating screens that display ActiveX controls. With worksheet cells, pictures, and shapes at your disposal, you will not have to create userforms to run your code unless you want to.
As stated above, projects are viewed in the Project Explorer window in the VBA Editor. It's default position is in the upper left-hand side of the Editor window when opened and looks like a file tree.
If you have multiple workbook files open at once, then you will see multiple projects in the Explorer window. To display any project item, just double click on its icon in the Explorer window. When first starting, it is better to have just have the workbook files open you are working with so you do not get your projects confused and add elements to the wrong one.
Please note that if you close a module window in the Editor, you do not loose your editing changes. They can be closed and opened at will. the changes will be saved when you save the project's workbook file.
Scroll < > picture if hidden.
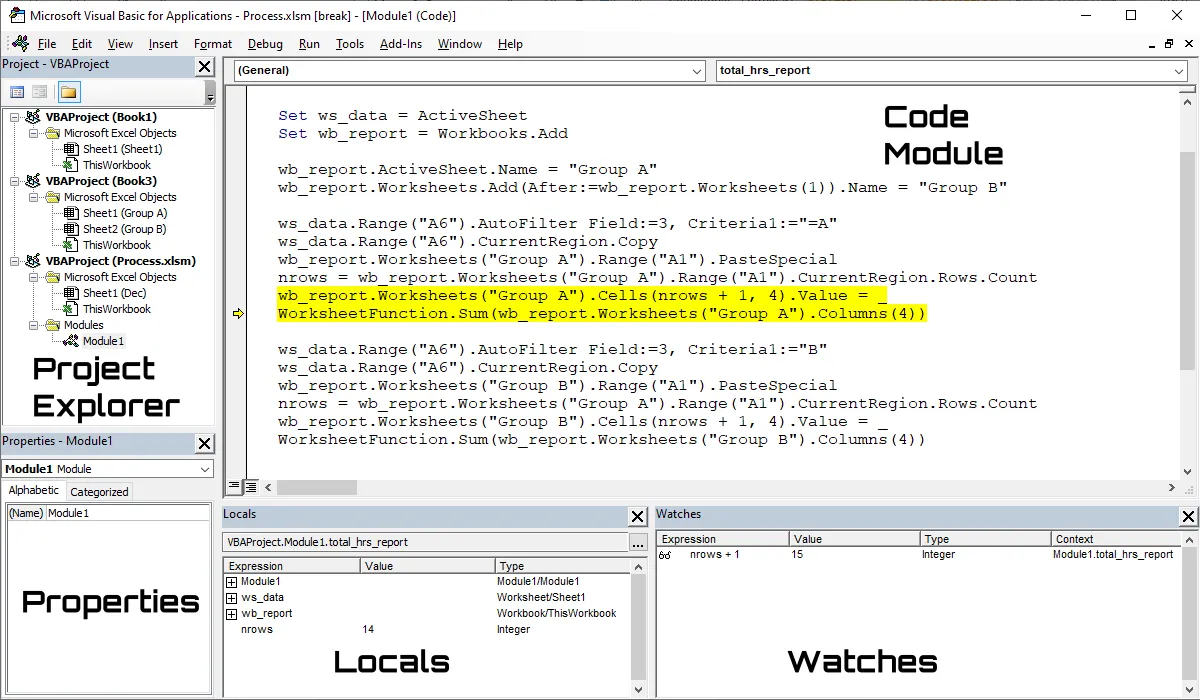
To determine what is the active project, the one you are working in, look in the Project Explorer window and you will see a faint grey highlight over the project element being worked on like a module (look in the pictures above for Module1 and the grey highlight). You can also check the caption in the Editor window at its very top to see the active project name.
It is important to know the active project because when you insert elements into a project like a module, it will be inserted into the active project. This is were people really get lost. Even though you are working on a project element and it is active (i.e. selected), you can switch project focus by clicking on another project's elements in the Explorer window which will turn it blue.
Please note that just clicking on another project's element does not display it, you have to double click for that. Confusing right? You bet yea. Just remember this rule, if you want to insert an element into a project (View / Insert menu), just click anywhere inside its project tree in the Explorer window, then add the element.
When an element is added, that element will go active in the Explorer. Just a note, it is not a good idea to add elements while debugging.
The commands to open the Editor windows are found under the View menu in the Editor. In particular, to open the Project Explorer window, proceed to the Editor menu and select View / Project Explorer. To close a window, look in the upper right-hand corner of the window and click the black x.
You can also move an Editor window around by clicking and holding on its caption bar and dragging it. However it is very hard to get some of Editor windows to re-dock where you want them. It involves taking an edge of the window you are docking and dragging and moving it against the edge of the Editor window. This is better done on the main computer monitor, not the added screens. It is highly recommended when first starting that you leave them alone in the position they come up in.
The Editor toolbars are grouped under Toolbars in the View menu. Just check a toolbar command to make it appear and uncheck it to make it disappear. To dock a toolbar, just click and hold on its caption and drag it over an Editor window edge. You can also double click on the caption bar of a toolbar as well to quickly dock it in its last position. To undock a toolbar from the Editor, find the three vertical dots on the left-hand side of the toolbar, click and hold, and drag it.
When using the toolbars, the author leaves the Standard toolbar docked at the top and the Debug and Edit toolbars floating free in the editor. A note here, if using multiple monitors, a toolbar that is not docked may appear on another screen when the Editor is opened or the toolbar is opened so look around for them.
Scroll < > picture if hidden.
To adjust the settings of the VBA Editor, proceed to the Editor menu bar and select Tools / Options. You will find the Editor settings on the Options dialog box.
To adjust what libraries are being referenced by a project, select the project, proceed to the Editor menu bar, and select Tools / References. You reference a library so you can command its associated program. Note that there are other ways to command a program besides directly referencing it.
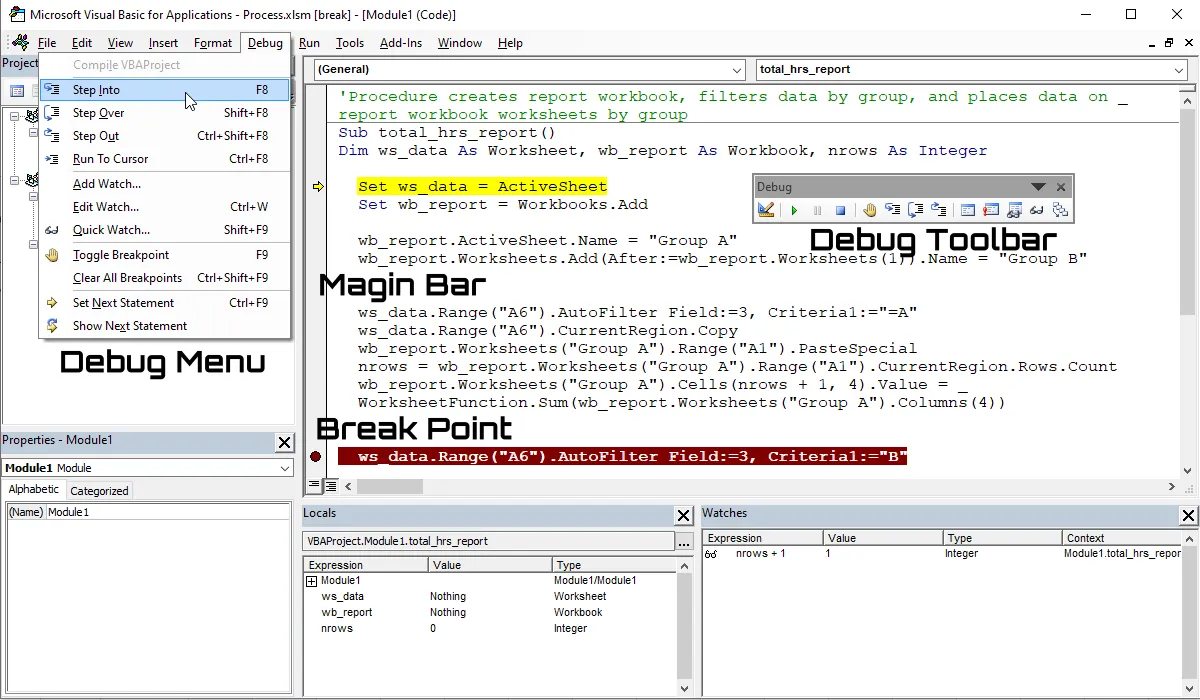
To debug your VBA code, you have to enter what is called break mode which means you stop a running procedure. There are two primary ways to do so.
Once in break mode, you can step through your lines of code using the Debug toolbar, Debug menu, or shortcut keys. Pressing the function key F8 or clicking the Step Into button on the Debug toolbar steps through your code line by line. The yellow line is the call to stack marker and it is the line about to be run. Step past the line and that line is executed.
You also use the Step Over (Shift+F8) and Step Out (Ctrl+Shift+F8) debug functionalities when dealing with procedure calls while debugging. You can use the Locals and Watches windows to monitor code while debugging. You can also hold your mouse cursor over a variable to see its value while debugging.
If you are done debugging a section of your code and you wish to run the rest of the procedure, press the function key F5. Make sure you step past the End Statement of a procedure to end break mode or run the procedure completely using F5. Do not leave a procedure in break mode!
To watch a calculation (called an expression), you can highlight it, press Shift+F9 to launch the Quick Watch dialog box, and add it to the Watches window. Quick Watch can also be found on the Debug toolbar. You can also use the Quick Watch window to quickly view the expression value without adding it.
If you are done debugging a procedure, do not forget to clear your break points so the procedure will run without breaking. You can clear all your break points by pressing Ctrl+Shift+F9 or using the Debug menu. Without knowing how to debug your code, you cannot create a sophisticated Excel VBA app.
If you just want to test a finished procedure before assigning it a button >, click in the procedure and press F5 to run it. This assumes the procedure has no argument list.
Scroll < > picture if hidden.
Excel Training Services
Excel Classes - Business and Industry
- Beginning Excel for Business and Industry
- Intermediate Excel for Business and Industry
- Advanced Excel for Business and Industry
- Excel Dashboards for Business and Industry
- Beginning Excel VBA for Business and Industry
Excel Classes - Engineers / Scientists
- Microsoft Excel for Engineers for Scientists
- Excel Data Analysis for Engineers and Scientists
- Excel VBA for Engineers and Scientists
- Excel VBA Data Analysis for Engineers and Scientists
- Adv Excel VBA Design for Engineers and Scientists
- Calling Fortran DLLs from Excel VBA
Excel Software Design/Consulting
Microsoft Excel Manuals
- Microsoft Excel Solutions Handbook
- Creating Advanced Excel VBA Apps
- Excel VBA Handbook for Engineers and Scientists
- Excel VBA App Design for Engineers and Scientists
EMAGENIT Company Information
US Military
Copyright © 2002-2023
EMAGENIT All Rights Reserved